Quicklook products are currently produced for six Cluster instruments; CIS
(ions), EFW (spacecraft potential), FGM (magnetic field), PEACE (electrons),
STAFF (electric and magnetic field fluctations) and WHISPER (high frequency
electric field fluctations). A description of all the Cluster instruments is
available here.
The quicklook plots are produced at two resolutions, i) Six-hour plots at 1
minute resolution and ii) Whole orbit plots (~57 hours) at 10 minute resolution.
Data is normally only presented from one of the four spacecraft (SC3, Samba).
This is the spacecraft that has been selected by the Cluster Science Working
Team (SWT) as the reference spacecraft and that will be used for the generation
of the one-minute validated Summary Parameter data.
In the case of line plots the colour of the line indicates the spacecraft used
(Black=SC1:Rumba, Red=SC2:Salsa, Green=SC3:Samba,
Blue=SC4:Tango). Science data is taken during about
50% of the orbit and will normally be stored using the on-board solid state
recorders. Data is downloaded to ESA's Villafranca del Castillo Satellite Tracking
Station (VILSPA). Since a single groundstation is being used to support all
four Cluster spacecraft there can be a delay of several days between data acquisition
and transmission to the ground.
There are currently three quicklook plot styles defined. The
Overview plot provides data from all six instruments showing
basic field, particle and wave information. The Fields and
Waves concentrates on data from the the FGM, STAFF and WHISPER
instruments, while the Particles display shows data from CIS
and PEACE. The magnitude of the magnetic field (from FGM) is common to all three
plot styles. A thumbnail of the GSE orbit position for the reference spacecraft
is also common to all the quicklook plots.
CIS - The Cluster Ion Spectrometry Experiment
|
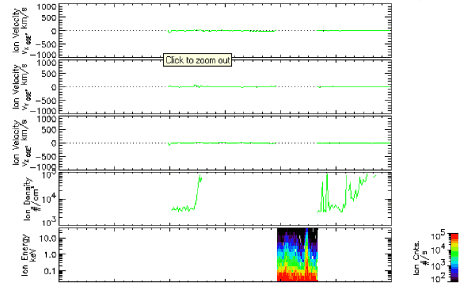
The CIS instrument will provide low energy ion density, velocity and
spectral information.
Overview: Three panels, Ion Speed, Ion Density, Ion Spectrogram
Fields and Waves: N/A
Particles: Same as Overview except three component ion velocity
instead of speed (TBC).
This has recently been changed so that the velocity is now represented
as a magnitude and two direction angles theta, phi (GSE).
|
 |
EFW - Electric Field and Waves experiment
| EFW provides a measure of the spacecraft potential. The Overview
plot show the spacecraft potential from the reference spacecraft and from
spacecraft 1 (Rumba). The ASPOC instrument will not be operated on Rumba
and in this case the potential can be used as a measure of the plasma
density. High density results in low S/C potential, low density in high
S/C potential. We therefore plot minus the S/C potential to aid the use
of this parameter as a proxy for the plasma density. Comparison of the
potentials from Rumba and the reference spacecraft (Samba) provides an
indication of the operation ASPOC instrument on Samba and may be useful
when looking at the low energy PEACE data. |
FGM - The Flux-Gate Magnetometer Experiment
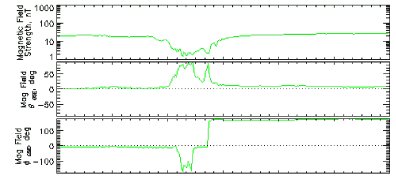 |
The FGM instrument will provide DC magnetic field information.
Overview: Field magnitude
Fields and Waves:Field magnitude and two direction angles theta,
phi (GSE).
Particles: Same as Overview. |
PEACE - The Plasma Electron And Current Experiment
The PEACE instrument will provide low energy electron information.
Overview: Electron spectrogram
Fields and Waves:N/A
Particles: Same as Overview except that the spacecraft potential
has been overplotted (dotted < 30eV and solid > 30eV) |
 |
STAFF - Spatio-Temporal Analysis of Field Fluctuations
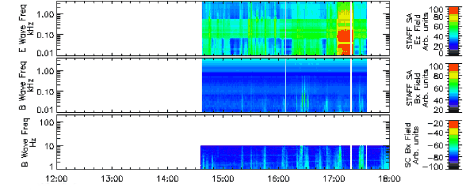 |
The STAFF instrument will provide information on fluctuations in the
magnetic and electric fields.
Overview: Bx Spectrogram from the STAFF Spectral Analyser
Fields and Waves:Bx Spectrogram from both the Spectral Analyser
and direct search coil measurements. Also Ez from the Spectral Analyser.
Particles: N/A |
WHISPER - Sounder and High-frequency Wave Analyser Experiment
The WHISPER instrument will provide information on the high frequency
Electric field fluctuations .
Overview:Electric field spectrogram
Fields and Waves:Same as overview.
Particles:N/A. |
 |
Data Collection Mode
Below the time axis of each plot are displayed a set of horizontal lines. The
thickness of these lines indicate the telemetry collection mode on each of the
four spacecraft. A thin line indicates that a spacecraft was operating in normal
mode, a think line denotes the enhanced burst mode and no line means that the
spacecraft was not in a science collection mode. The lines are colour coded
according to the spacecraft (from top to bottom; Black=SC1:Rumba, Red=SC2:Salsa,
Green=SC3:Samba, Blue=SC4:Tango).
This information is only added once the Summary Parameter Auxiliary files become
available and so will not be displayed on the most recent data.
Predicted Spacecraft Position
Information on the position of the reference spacecraft is taken
from the JSOC catalogue files (please
visit the JSOC web site for more information).
A sub-set of these data are plotted including the location, L-shell and Magnetic
Local Time of the reference spacecraft, and some of the four spacecraft configuration
parameters (elongation, planarity and size). The full data set can be accessed
from the national data centres.
Field tracing using T96 (s/w pressure 4, DST -10, IMF BY -2, BZ 5.0) has been
used to calculate the approximate location of the magnetic footprint when the
spacecraft are inside the magnetosphere.
For these plots the latest (>|) control on the interface will take you to the plot corresponding to the
latest quicklook plot. There will usually be predicted position plots beyond
this, and these can be accessed either using the forward (>) control or by
setting the date.
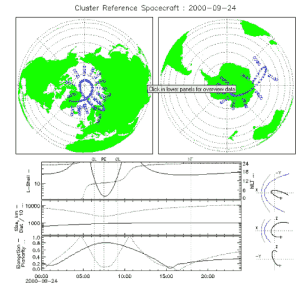 |
The following JSOC predicted scientific
events are also marked.
PE - Perigee
AP - Apogee
QL - Auroral Oval
NT/ST - Tail Xgse < -10 Re
NS - Neutral Sheet Crossing
MP - Magnetopause
BS - Bow Shock
|
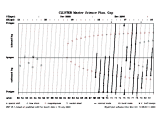
| To simplify selection of particular orbits, a page based on the JSOC
Master Science Plan, Bryant plots is provided. Clicking inside the plot
will display the corresponing quicklook whole orbit plot. A separate browser
window (target name "Cluster_Quicklook") will be used allowing quick navigation
of of the MSP. |
 |
Predicted Spacecraft Orbit/Configuration
Each of the data plots has a small thumbnail schematic of the orbit in GSE.
In the case of the whole orbit plots, clicking on the thumbnail will take you
to a full size view of the GSE orbit and of the constellation configuration.
Constellations are plotted every 9.5 hours and the phasing is shifted slightly
so that over a number of plots the evolution round the orbit can be seen. The
orbit is coloured according to the reference spacecraft (green= SC3 in the example).
The other spacecraft are plotted relative to the reference spacecraft and expanded
by a factor of ~ 10 to 35 to allow them to be viewed on the orbit plot. The
first constellation after perigee has the reference spacecraft marked with a
diamond.

CSDSweb Quicklook Plots Index .
Maintained by Chris Perry; Last updated
13th Jul 2001


